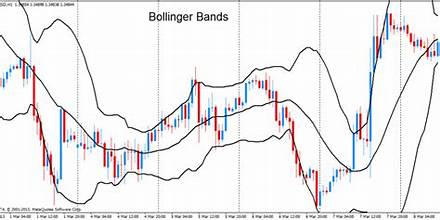
As Malaysia continues to establish itself as a growing financial hub in Southeast Asia, stock market analysis techniques are increasingly vital for investors aiming to make informed decisions. One of the most widely used technical analysis tools is Bollinger Bands, which provide insights into price volatility, trends, and potential buy or sell signals. This article explores how investors in Malaysia can leverage Bollinger Bands for more precise stock market analysis.
What Are Bollinger Bands?
Bollinger Bands, developed by John Bollinger, consist of three lines plotted on a stock’s price chart:
Middle Band: A simple moving average (SMA), usually set to 20 periods.
Upper Band: Two standard deviations above the middle band.
Lower Band: Two standard deviations below the middle band.
The bands expand and contract based on market volatility, making them a dynamic tool for traders and investors.
Why Use Bollinger Bands in Malaysia?
Malaysia’s stock market, represented by indices like the FBM KLCI, is influenced by various factors such as commodity prices, political developments, and global market trends. Bollinger Bands are particularly effective in such environments because they adapt to changing market conditions, allowing traders to assess volatility and identify opportunities.
Key Applications of Bollinger Bands
Identifying Overbought and Oversold Conditions
When prices touch or move above the upper band, it often signals overbought conditions, suggesting a potential reversal or correction.
Conversely, when prices hit the lower band, it may indicate oversold conditions, presenting a potential buying opportunity.
For example, an investor analyzing Malaysian blue-chip stocks like Maybank or Petronas could use Bollinger Bands to determine if the current price is overstretched.
Spotting Breakouts
Bollinger Bands help detect breakouts when the price moves outside the bands. In Malaysia’s often range-bound stock market, breakouts can signal the beginning of new trends. Traders can monitor the contraction of the bands, known as a “squeeze,” which typically precedes significant price movements.
Assessing Market Volatility
The Malaysian market is prone to periods of heightened volatility, especially during key events like Budget announcements or shifts in global oil prices. Bollinger Bands visually represent this volatility, allowing traders to adjust their strategies accordingly.
Confirming Trends
When prices consistently stay near the upper band, it suggests a strong uptrend. Similarly, prices hovering near the lower band indicate a downtrend. Traders in Malaysia can use this to confirm bullish or bearish patterns in sectors like technology or plantations.
Steps to Use Bollinger Bands Effectively
Set the Parameters
The default setting of a 20-period SMA and 2 standard deviations works well for most Malaysian stocks. However, traders can adjust these settings based on specific stocks or time frames.
Combine with Other Indicators
Bollinger Bands are most effective when used with complementary indicators. For instance:
Relative Strength Index (RSI): To confirm overbought or oversold conditions.
Volume Analysis: To validate breakouts.
Analyze Historical Patterns
Review historical price movements of Malaysian stocks like Top Glove or Tenaga Nasional to understand how they respond to Bollinger Band signals. This can help fine-tune your strategy.
Backtest Your Strategy
Before committing capital, use past market data to test how well your Bollinger Band-based strategy performs in Malaysia’s unique market environment.
Practical Examples in the Malaysian Market
Trading Blue-Chip Stocks
For a stable stock like CIMB, Bollinger Bands can help identify periods of consolidation and subsequent breakouts. For instance, during a contraction phase, traders can prepare for a breakout, either upward or downward, based on additional signals.
Volatile Stocks and Sectors
High-volatility stocks, such as those in the technology sector (e.g., Inari Amertron), often exhibit strong reactions to Bollinger Bands. Monitoring the upper and lower bands during earnings announcements can help traders anticipate price swings.
Commodity-Linked Stocks
Given Malaysia’s reliance on palm oil and petroleum exports, stocks in these sectors are sensitive to global commodity price changes. Bollinger Bands can help traders react quickly to these shifts by identifying overbought or oversold conditions.
Limitations of Bollinger Bands
While Bollinger Bands are powerful, they are not foolproof:
False Signals: In a highly volatile market, prices can breach the bands without initiating a sustained trend.
No Standalone Strategy: Bollinger Bands should not be used in isolation; they are most effective when combined with other technical and fundamental analysis tools.
Lagging Indicator: As Bollinger Bands are based on historical data, they may not fully reflect sudden market changes.
Conclusion
Bollinger Bands offer a versatile and dynamic approach to stock market analysis, particularly in a diverse and evolving market like Malaysia’s. By helping investors assess volatility, identify trends, and spot trading opportunities, Bollinger Bands can enhance decision-making and risk management.
For Malaysian traders, combining Bollinger Bands with market-specific insights, such as macroeconomic data and sectoral trends, can yield even better results. Whether you’re investing in blue-chip stocks or exploring opportunities in emerging sectors, mastering Bollinger Bands is an essential skill for navigating Malaysia’s stock market.